Companion Resource

Troubled Waters
In this activity students perform an experiment on plant growth using saline water, acidic water, and alkaline water to determine the effects of water quality on plant growth.
Time to Complete
Materials
For the class:
- Distilled water (five gallons)
- Saline water (one gallon)
- Acidic water (one gallon)
- Alkaline water (one gallon)
- pH test strips
- pH Up and pH Down (available in the aquarium section of pet store for approximately $3)
- Four clear, plastic milk jugs with lids (to mix above solutions)
- 20 plants, all of same type (purchase six packs of marigolds, beans, or squash)
For each group:
(You will have 5 groups of students)
- Four plants
- Four labels
- Measuring cup
- Tray to set seedlings in
- Ruler with cm
For each student:
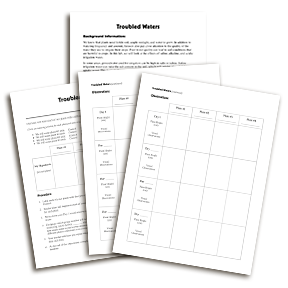
- Troubled Waters handout
Preparation:
Prior to the lesson, prepare the water solutions needed for the experiment.
- To make saline water: Add . cup salt to one gallon of distilled water.
- To make acidic water: Add pH Down to one gallon of distilled water until the pH is between 3 and 4. You can also use white vinegar if you don’t have pH Down.
- To make alkaline water: Add pH Up to one gallon of distilled water until pH is between 10 and 11. You can also use baking soda if you don’t have pH Up.
- For your control: Fill one gallon jug with distilled water.
- Appropriately label each gallon jug.
Procedures
- Temporarily cover up the labels of the solutions prepared in step 1. Ask students to consider what is in each of the containers. After they’ve made their predictions, reveal the actual contents. Discuss that clear liquids are not always pure water. Even regular tap water has various dissolved substances, such as chlorine, fluorine, and various minerals.
- Distribute a copy of the Troubled Waters handout to each student. Provide an overview of the lab procedures and a demonstration of the plant experiment set up.
- Divide students into five equal groups. Distribute four plants and four labels to each group.
- Instruct students to label each seedling with one of the four water types (Acidic, Alkaline, Saline, Control). Ask groups to predict what will happen to the plants when watered with each of the four watering solutions. Students should complete the “My Hypothesis” section of the handout. Provide guidance in writing a hypothesis.
- Instruct each group to decide which group member will be in charge of watering each plant with the appropriate type of water. Stress the importance of making sure that each student waters their assigned plant with the correct type and amount of water every time. Demonstrate the watering technique and amount.
- Students should use a measuring cup to deliver a set amount of liquid to each plant. Measuring cups should be rinsed out between watering with each different type of water. Start out by having students water each plant with . cup of liquid, this should be enough to moisten but not saturate the soil. Check the plants in a couple of days and repeat the watering procedure when the soil appears to be drying.
- Show groups how to measure the height of their plants and how to make visual observations of their plants.
- Over the next two weeks, set aside four, 10-minute session for groups to water, measure, and observe their seedlings.
- After two weeks, have students complete the Troubled Waters handout. As a class, discuss how this experiment and the results relate to agriculture, pollution, and plant health. Emphasize that water quality is essential for plant health. Poor water quality will affect how much food is available for humans and other animals.
Variations
- Perform the same experiment with seeds, rather than seedlings.
- Make a mystery out of the lesson. Ask students to water the plants, but do not reveal what the liquids are. Ask them to guess what is in the liquids as the week passes and the plants become noticeably different.
ELL Adaptations
- Model the lab procedures so all students have a visual example of how to set up and carry out their experiments.
- Place ELL students in groups with other students who are proficient in reading and writing.
- Draw a step-by-step instructional diagram on the board.
File, Map, or Graphic
Author
Organization
Sources
This activity was originally developed in 1993 through a partnership between the California Department of Food and Agriculture, California Farm Bureau Federation, Fertilizer Inspection Advisory Board, Fertilizer Research and Education Program and the California Foundation for Agriculture in the Classroom. It was updated in 2013 with funding from the California Foundation for Agriculture in the Classroom and a grant from the California Department of Food and Agriculture’s Fertilizer Research and Education Program.
Original Author: Pamela Emery Executive
Director: Judy Culbertson Illustrator:
Erik Davison
Layout and Design: Nina Danner