Lesson Plan
The Water Footprint of Food
Grade Level
Purpose
Explore concepts of sustainability by evaluating the water footprint (WF) of food. Students are introduced to irrigation practices throughout the world, consumptive and non-consumptive water use, and investigate the water requirements for various food crops. Grades 9-12
Estimated Time
Materials Needed
Engage:
Activity 1: Irrigation Practices
- World map to project
- Water in Agriculture slide deck
Activity 2: Dinner Party Menu Challenge
- Dinner Party Menu Challenge, 1 copy per student
- Student access to Water Footprint Network's Product Gallery
- Water Footprint Team Totals chart to project
Activity 3: Types of Water
- Water Footprint Network's Product Gallery, project for class viewing
- Green, Blue, and Gray Water image to project
- Eating Less Meat Won't Save the Planet. Here's Why video
Vocabulary
irrigation: artificial application of water to the land or soil to assist plant growth
sustainability: a method of harvesting or using resources so that they are not depleted and/or permanently damaged
water footprint: volume of fresh water used to produce the goods and services consumed by an individual, community, or business
Did You Know?
- There is the same amount of water on Earth today as there was when the Earth was formed.1
- Nearly 97% of the world's water is salty or otherwise undrinkable. About 2% is locked in ice caps and glaciers leaving just 1% for all of humanity's needs.1
- Irrigation enhances both productivity and profitability of croplands by supplementing natural rainfall.2
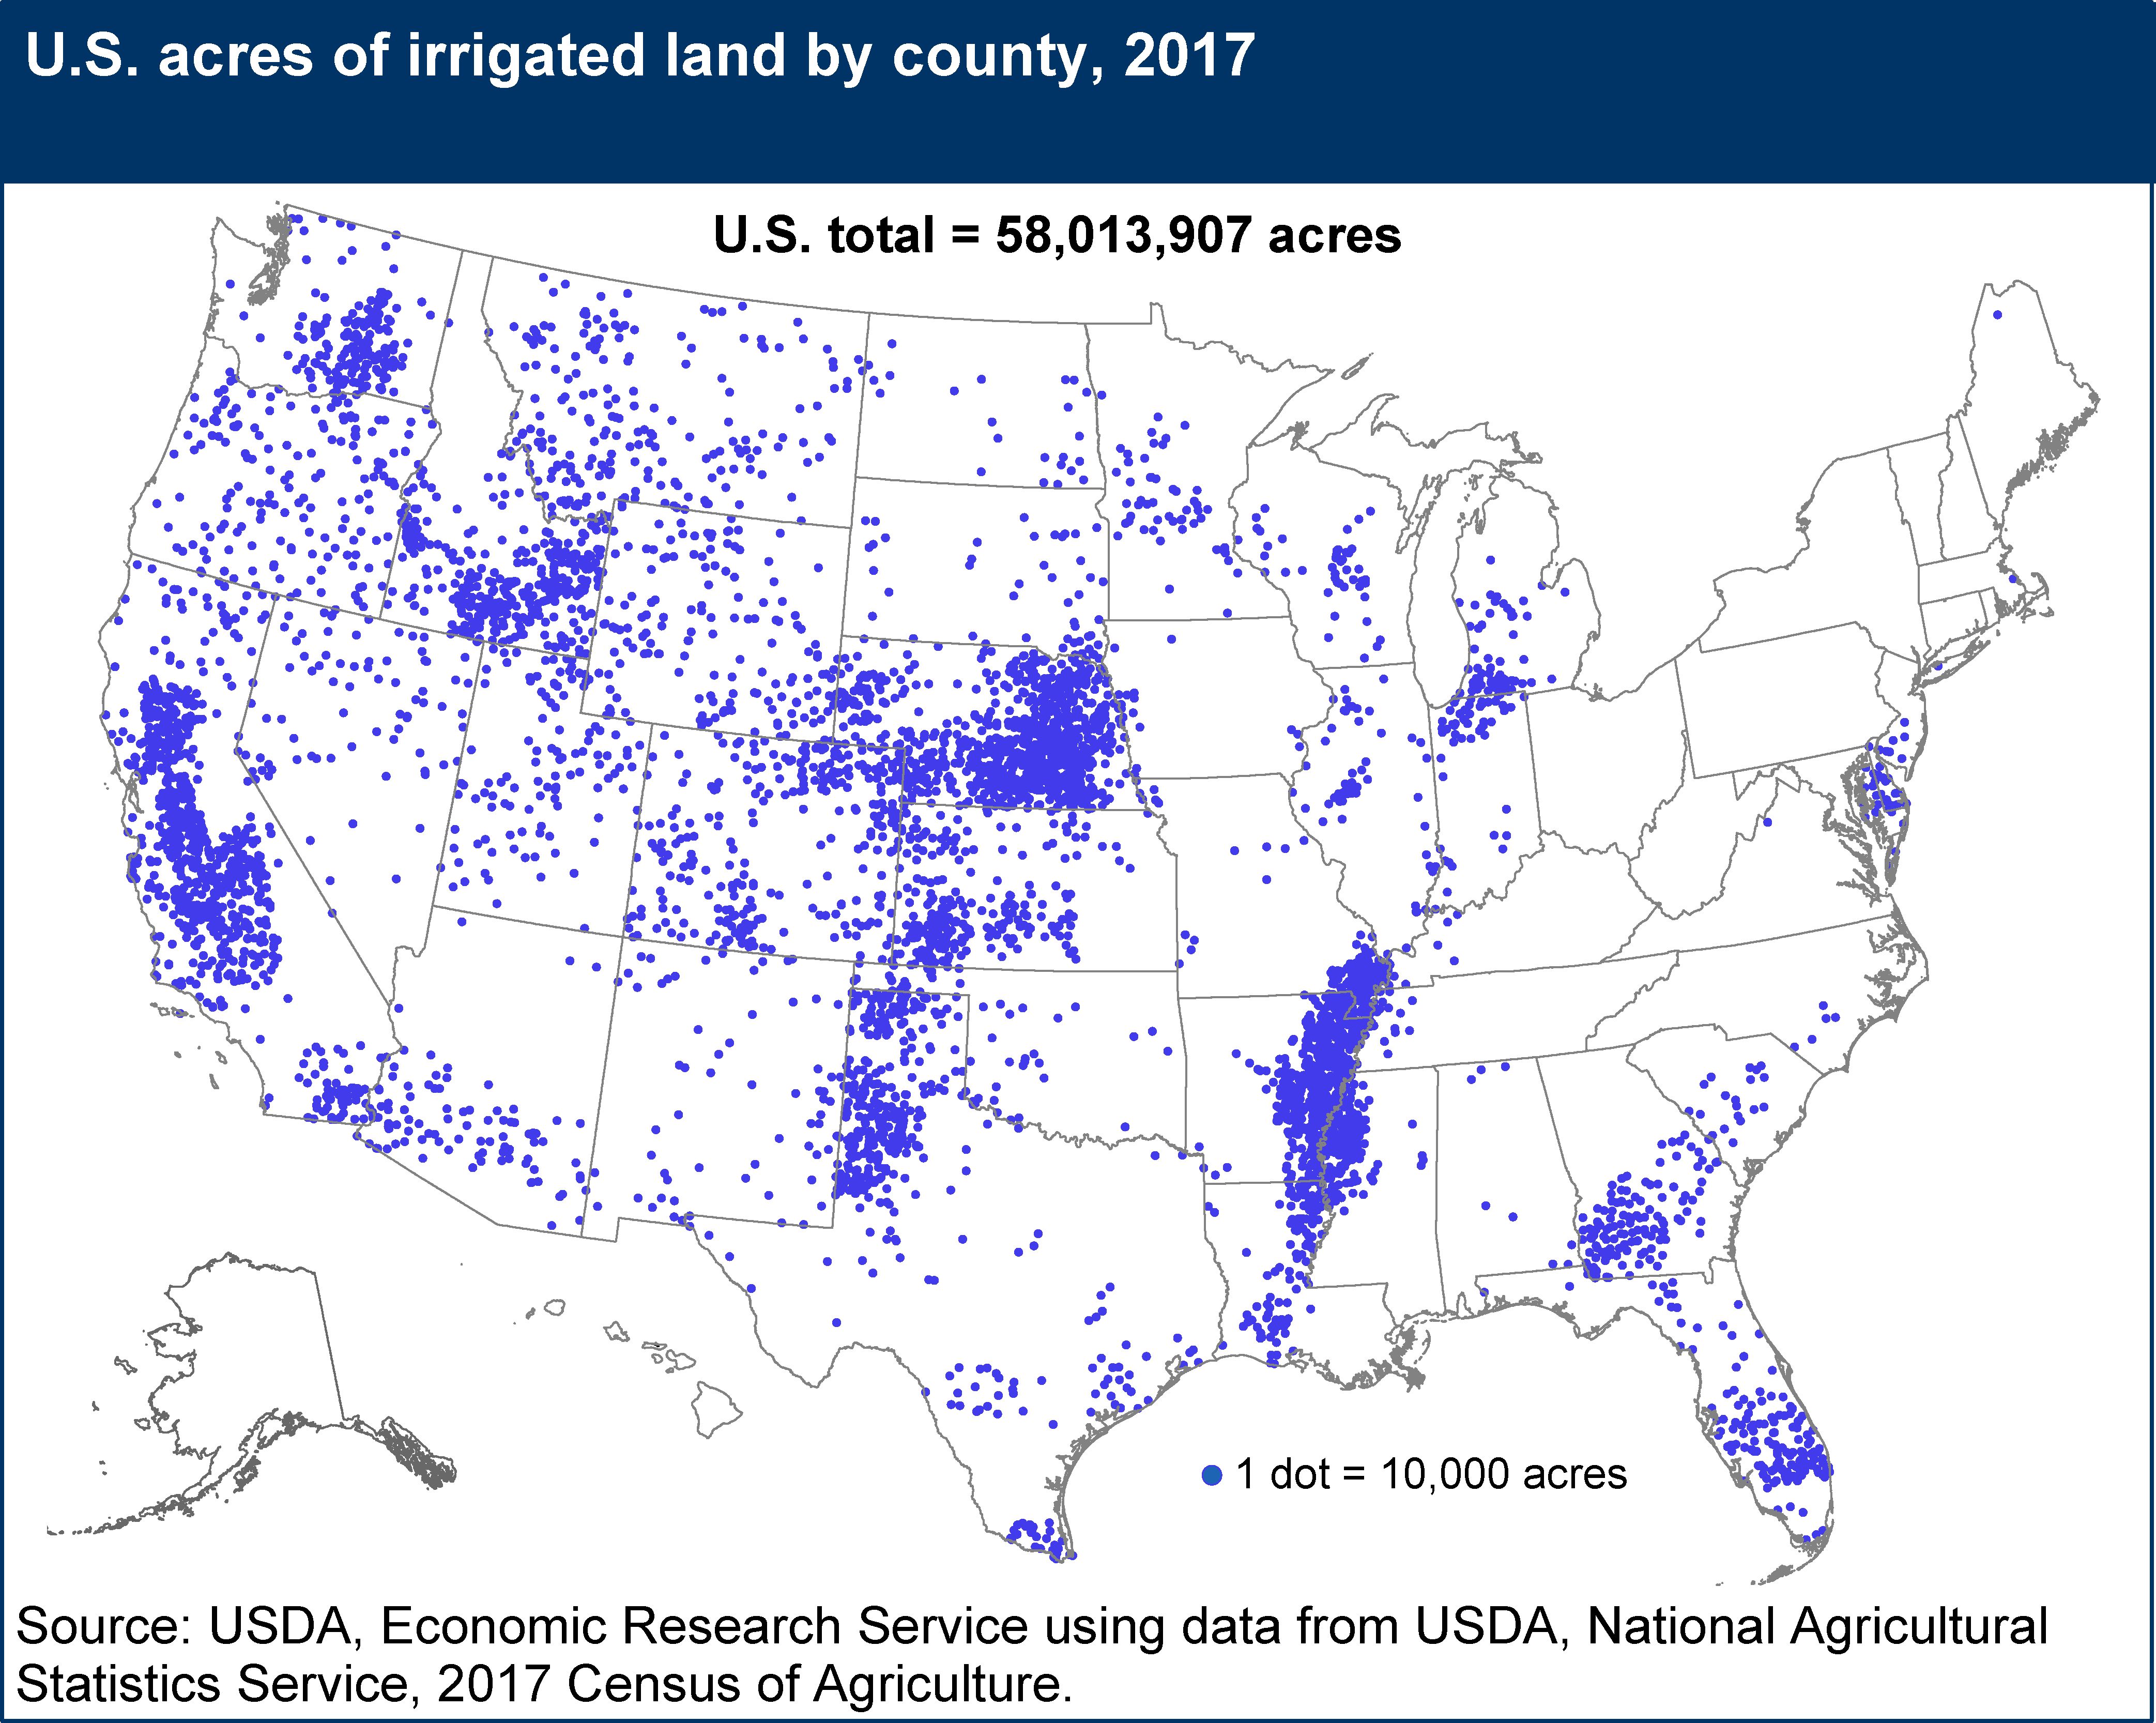
- Since 1890, irrigated acreage in the United States has increased from 3 million acres to nearly 56 million acres in 2018.2,12
Background Agricultural Connections
Water is a finite resource that is under stress as society attempts to meet the demand for uses such as food production, industrial production, and household washing and cleaning.3, 4 Furthermore, water availability varies worldwide with some regions being “water rich” and others “water poor.” Scarcity in water poor regions may be mostly due to natural climate conditions, but it can be exacerbated by other factors including pollution and increased demand to meet the needs of a growing population. Water rich regions can also experience scarcity due to increased demand among competing sectors and stakeholders within a particular region. Since agriculture is the largest consumer of water worldwide, it is an ideal topic for exploring how producers and consumers can reduce water demand and manage this resource in a more sustainable manner.
Sustainability, which was described in a prominent United Nations report as “development that meets the needs of the present without compromising the ability of future generations to meet their own needs”5, promotes the long-term view of resource management. Unfortunately, many of today’s environmental problems are related to actions driven by current needs without regard to the future. Freshwater has often been managed with this type of short-term thinking. Although it is true that water quality is a serious concern for most people, water quantity receives much less attention, presumably because it is thought to be an abundant, inexhaustible resource. For instance, some people may only think of water quantity in terms of direct contact uses such as for drinking or performing household washing and cleaning chores. However, people consume water indirectly through many actions including the foods we eat, the clothes we wear, and the manufactured goods we use in practically every other aspect of life6.
From a water management perspective, water use can be divided into two major categories: non-consumptive and consumptive3. Powering hydroelectric dams is a non-consumptive use because the water is still available in the lake or stream for other uses (e.g., drinking or irrigating crops), whereas, irrigating crops with water withdrawn from a lake or stream is consumptive because the water is no longer available for other uses. Agricultural production—mostly irrigation—is by far the largest consumptive use of water worldwide.3, 7 Therefore, efforts to promote sustainable use of water resources need to focus more closely on how it is used in food production.
An important tool in promoting sustainable use of water is a concept known as Water Footprint (WF), which was developed as a “metric to measure the amount of water consumed to produce goods and services along the full supply chain.”8, 9, 10 For example, the WF of an apple would include the water inside the apple, plus all the water used to grow, harvest, process, package, and transport the apple to the grocery store. Hoekstra and Mekonnen7 applied this concept to global water use and found that, for the period 1996-2005, agricultural production accounted for 92% of the global WF, followed by industrial production (4.5%) and domestic water supply (3.5%). These results support the notion that agriculture is where society can make the greatest gains in reducing its water footprint, and for the average consumer, in the foods included in our diets. The Water Footprint Network provides information about the sustainable use of fresh water. A compelling component of this network is the Water Footprint Assessment Tool that quantifies and maps water use. Students can explore agriculture’s use of water in the production of crops and livestock. Also available on this website is the Product Gallery that compares the amount of water used to make a variety of common products. It is important to note that the water footprint values of these products is based on global averages, i.e., the water footprint of a particular food will depend on the local conditions of where it was produced (water availability, climate conditions, soil fertility, farming methods, harvesting and processing) and whether it was a local or exported food.
Engage
- Explain that water is a resource necessary for life. Access to freshwater for daily living and for the production of our food (agriculture) is not the same in every area of the world. Some areas have water shortages while others have water, but struggle to protect it from contamination.
- Watch, Are we running out of clean water? Before showing the video clip ask students to think critically as they watch and to be alert to statements they could question. Instruct students to write down at least three questions they should research further to check for accuracy and better understand water availability and consumption throughout the world.
- Following the video, ask for student volunteers to share their questions. Guide class discussion to the following questions:
- Does agriculture really use 92% of our water?
- Why are shelled nuts and red meat considered water intensive?
- Would a vegetarian lifestyle really reduce our water footprint by 1/3?
- Write these questions on the board and invite students to keep these questions in mind as they explore the connection of water and our food.
Explore and Explain
Activity 1: Irrigation Practices
- Project the world map on the board.
- Ask students to look at the six countries that are highlighted in blue. On a sheet of paper, ask students to rank these countries in order by the acreage of land that is irrigated—highest to lowest. Students should use their own logic and background knowledge to formulate a guess. Tell them to specifically consider the number of acres irrigated to produce crops, trees, and pastures.
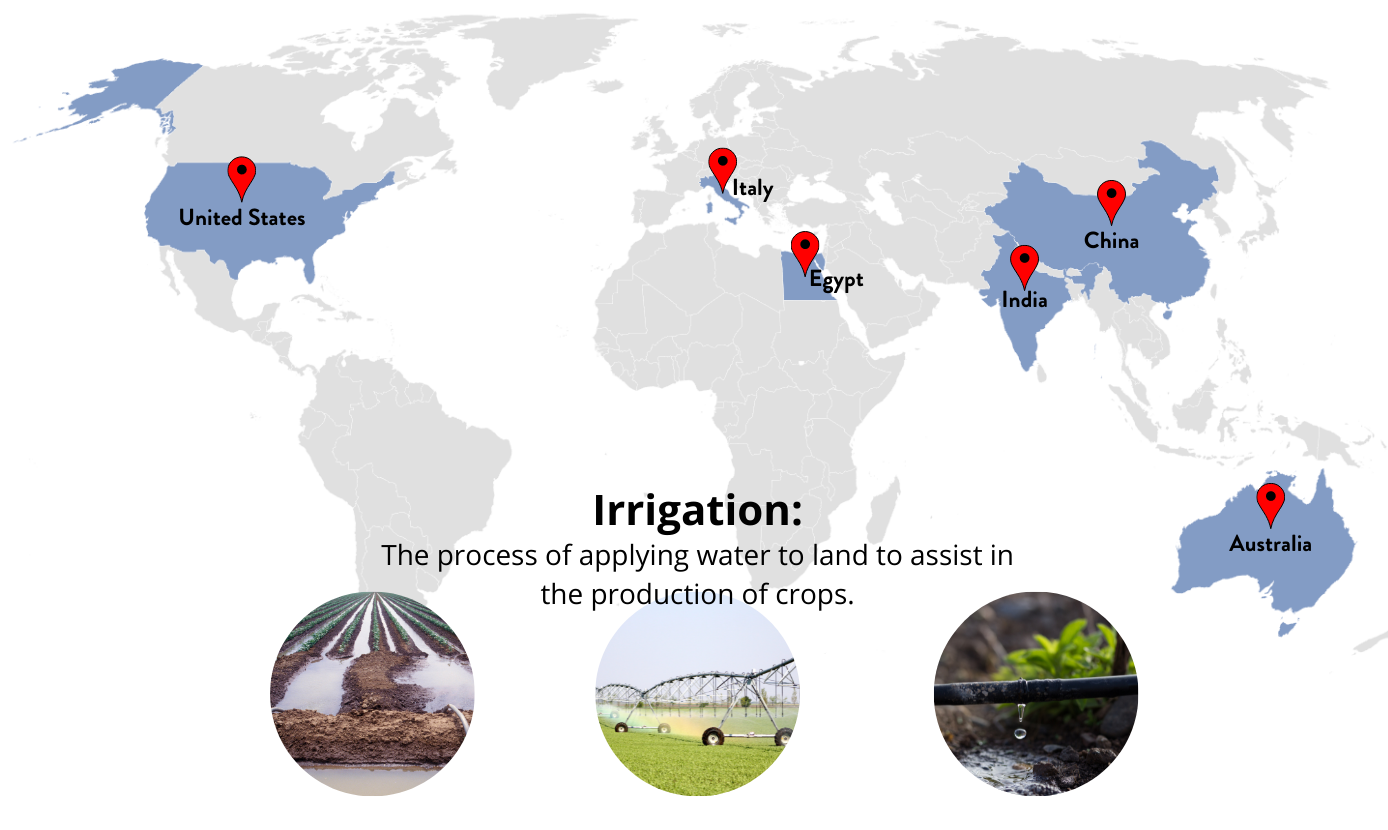
- Share the correct answers11:
- China 171.5 million acres
- India 164.8 million acres
- United States 65.2 million acres
- Italy 9.8 million acres
- Egypt 9.0 million acres
- Australia 6.3 million acres
- Remind students that one acre is approximately the size of a football field. Were they surprised by the correct answers and the amount of irrigated land in these countries? Do they see any correlations between irrigated land and population, climate, or the amount of land area in each country?
- Ask, "Why do farmers irrigate their land?" After students share their ideas, review the Water in Agriculture slide deck to discover consumptive vs non-consumptive water use and explore statistics related to water in agriculture.
- Return to the questions from the Engagement portion of the lesson. Answer the first question. Yes, it is estimated that 92% of all water that is consumed (not withdrawn) is from the agriculture industry. Water use varies throughout the world and is determined by factors such as climate, available technology, and the presence of manufacturing.
Teach with ClarityPrompt students to study statistics carefully. In this lesson they should pay close attention to the words withdrawn and consumed to better understand each statistic. They should also be aware of the region it represents. Some statistics give global averages and others are specific to a particular country or region. Misconceptions arise more when these details are overlooked. |
Activity 2: Dinner Party Menu Challenge
- Give each student one copy of the Dinner Party Menu Challenge.13
- Divide the class into groups of 3-4 students. Inform the class that they have been challenged to create a water-conscious dinner menu. Instruct students to follow the step-by-step instructions. Students will need internet access to use Water Footprint Network's Product Gallery to discover the water footprint of the foods in the menu they are creating.
- When students reach Step 3, project the Water Footprint Team Totals chart on the whiteboard for each team to record their totals. Determine the winning team(s) for the lowest WF for the entire meal as well as for each course.
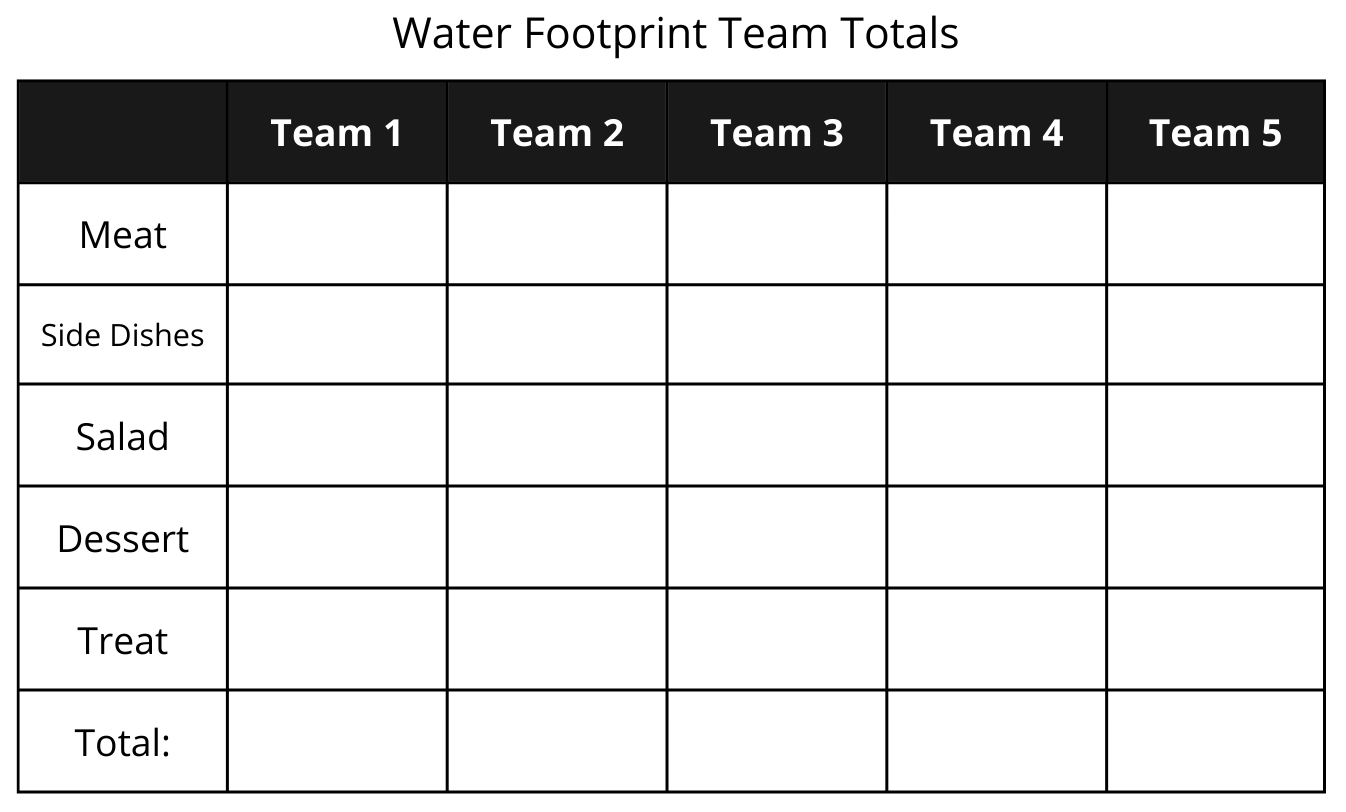
- Summarize the activity by reviewing the discussion questions in Step 4 with the entire class.
Activity 3: Types of Water
- Now that students have a general idea of the water footprint of many different foods, ask students what they think are some solutions to shrink our water footprint from the food we eat. Students will likely begin to conclude that we should eliminate or decrease our consumption of foods with a high water footprint.
- Draw the students' attention back to the remaining questions outlined in the Engagement portion of the lesson. Ask students to think critically about the claims made in the video about red meats, tree nuts, and animal-source foods. Are they scientifically correct? Do they look at multiple perspectives? Are there any other details that if evaluated could change the perspective of the (water) sustainability of specific foods? Explain that we want to dig a little deeper to see if these claims are true.
- Project Water Footprint Network's Product Gallery on the board and select any food. Point to the green, blue, and gray water drops. Ask students if they know what these colors represent and if they considered them in their Dinner Party Menu Challenge from Activity 2. Explain that to evaluate water footprint thoroughly, the type of water used is important to the big picture.
- Project the Green, Blue, and Gray Water image on the board and explain the differences between each type of water.
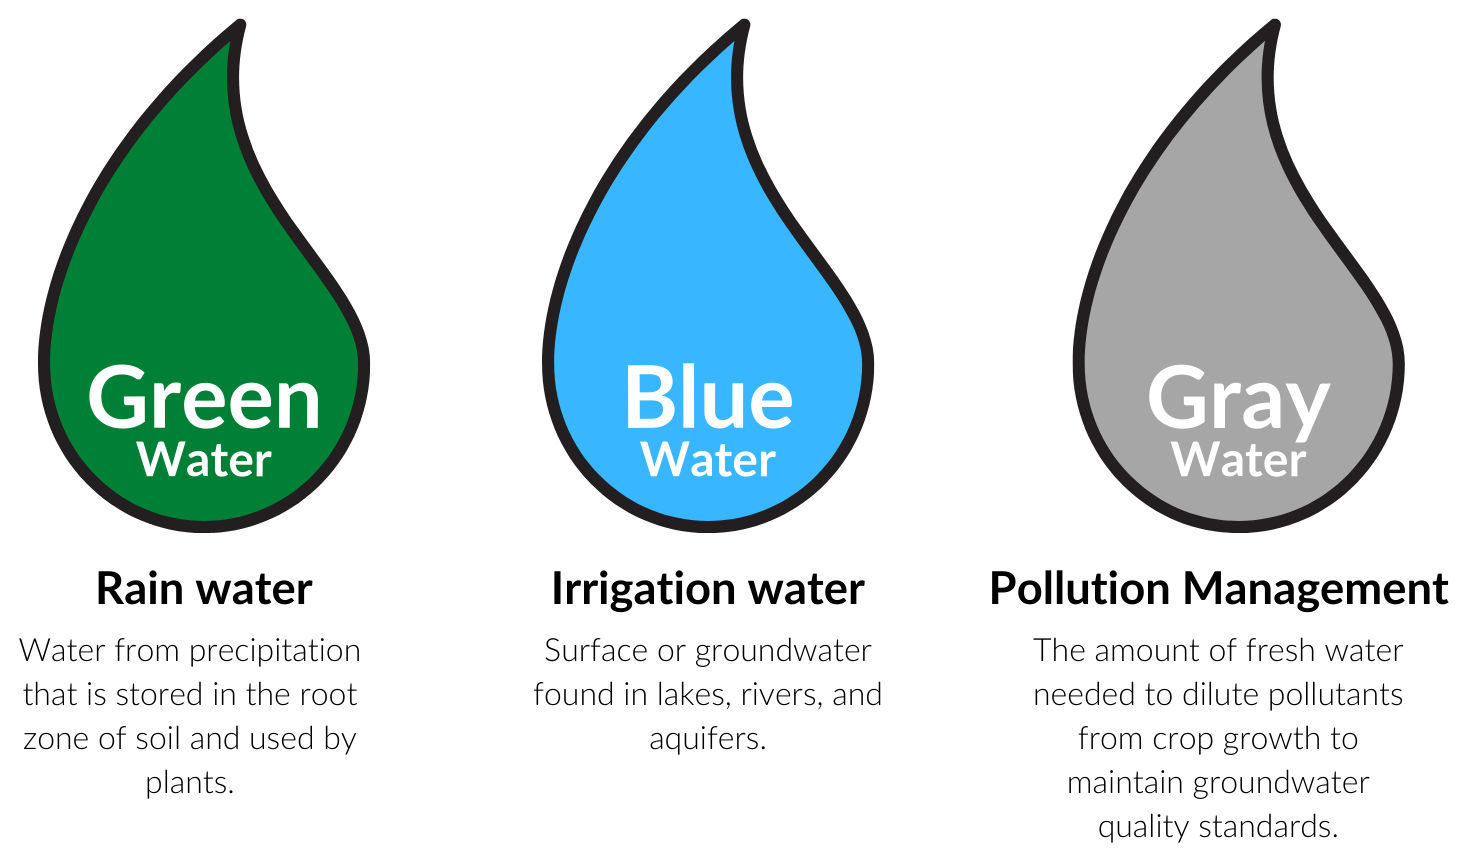
- With this new information, go back to the Product Gallery and slide to view the information about beef. Beef has the highest water footprint (per kilogram) of any food in the gallery. Ask students to reevaluate beef looking at the type of water used to produce it. Ask students if this information changes any of their thoughts or perspective. Slide through other foods to gain perspective of other ratios of green, blue, and gray water.
Teach with Clarity
To understand why beef and lamb have such a high percentage of green water in their water footprint, students must recognize that beef cattle and sheep spend the vast majority of their lives eating grass and other forages that grow from rainwater. These livestock animals have a 4-chamber ruminant stomach. This unique digestive system allows them to obtain nutrients from grass and other forages that grow on marginal lands.
- Introduce the video clip by explaining that it's common to see media stating that reducing or eliminating red meat from our diets will improve the health of our planet (For example, the video viewed in the Engagement portion of the lesson). Encourage students to focus on the question "Do cattle really take all the water?" as they watch a portion of Eating Less Meat Won't Save the Planet. Here's Why. In this video clip the host discusses the water footprint of beef with Dr. Frank Mitloehner, a professor at UC Davis. Begin video at 2:56 and stop at 4:26.
- Ask students to share their reflections and questions. Lead a class discussion to summarize that evaluating the water footprint of food (and other environmental issues) has multiple dimensions. Only looking at one measurement or perspective (such as the total water footprint of food) is just the start and can be misleading if we stop there. Asking more questions and finding more details (such as types of water) adds to our understanding and evaluation of the big picture of sustainability.
Concept Elaboration and Evaluation
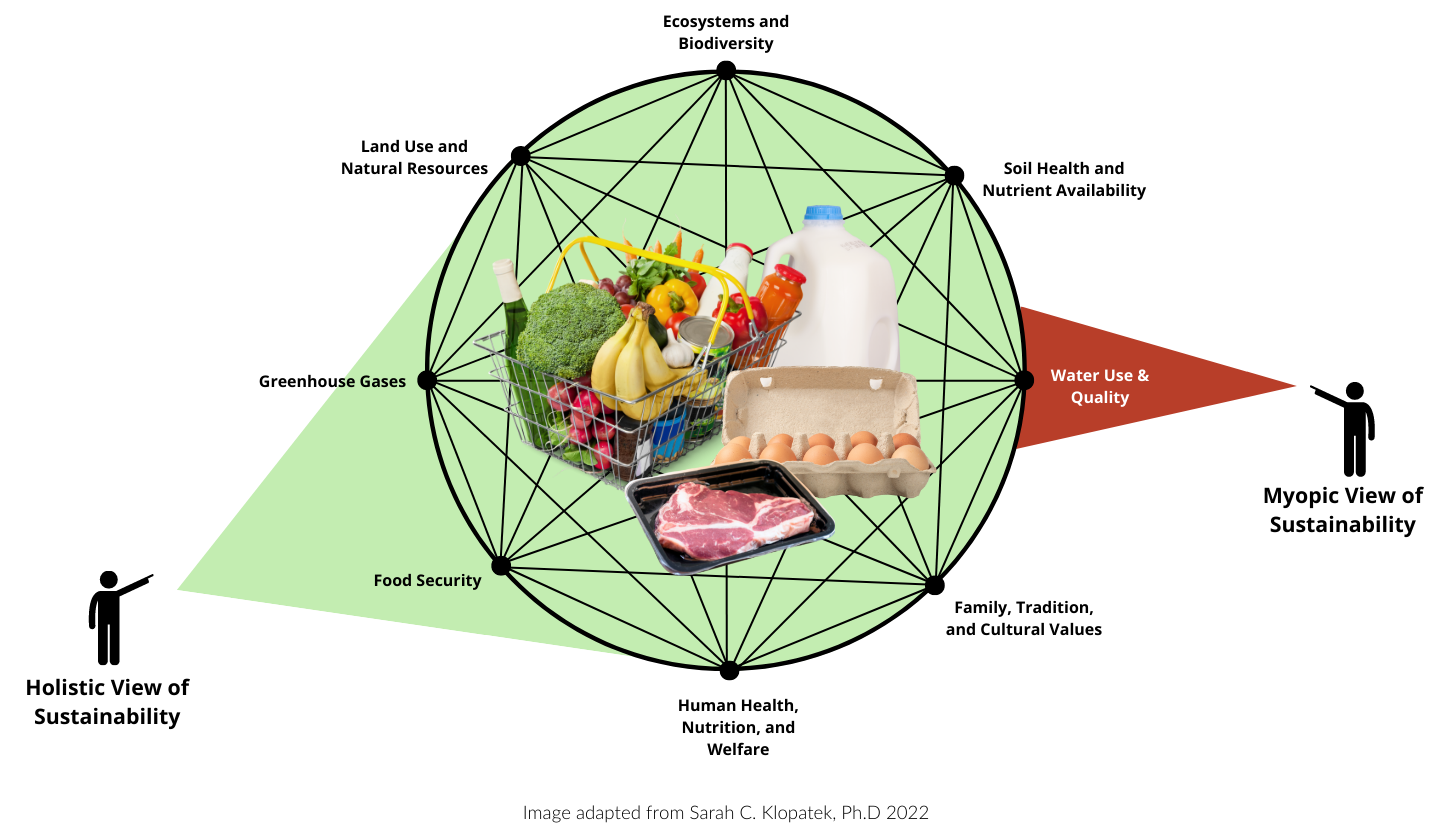
- Open the Water in Agriculture slide deck. Project slide 13 and discuss the concept of sustainability. Water management is one factor in sustainability.
- Discuss more topics in sustainability (slide 14) and how each element is connected (slide 15). Like a web, each connection is important to the other. No element stands alone and every element relies on another.
- Define myopia as the ability to only see things up close. Display slide 16 and explain that looking at water use alone does not accurately evaluate sustainability in regards to our food supply. Sustainability needs to be evaluated holistically (slide 17).
- Take a final look at the three questions from the Engagement section of the lesson:
- Does agriculture really use 92% of our water? (Yes)
- Why are shelled nuts and red meat considered water intensive? (They require the most water to produce. In the case of red meat such as beef and lamb, over 90% of the water they use is the rainwater that grows the grass and forages these livestock eat. Meat, predominantly beef, has a higher water footprint because it has a longer lifecycle.)
- Would a vegetarian lifestyle really reduce our water footprint by 1/3? (Animal-source foods require more water than plant-based foods. However, elimination of entire food commodities would lead to unintended consequences that impact other areas of sustainability. See slides 18-20 for examples. Remind students of the web demonstration from steps two and three. All factors of sustainability need to be considered. Eating meats (if desired) within healthy serving recommendations supports overall sustainability.)
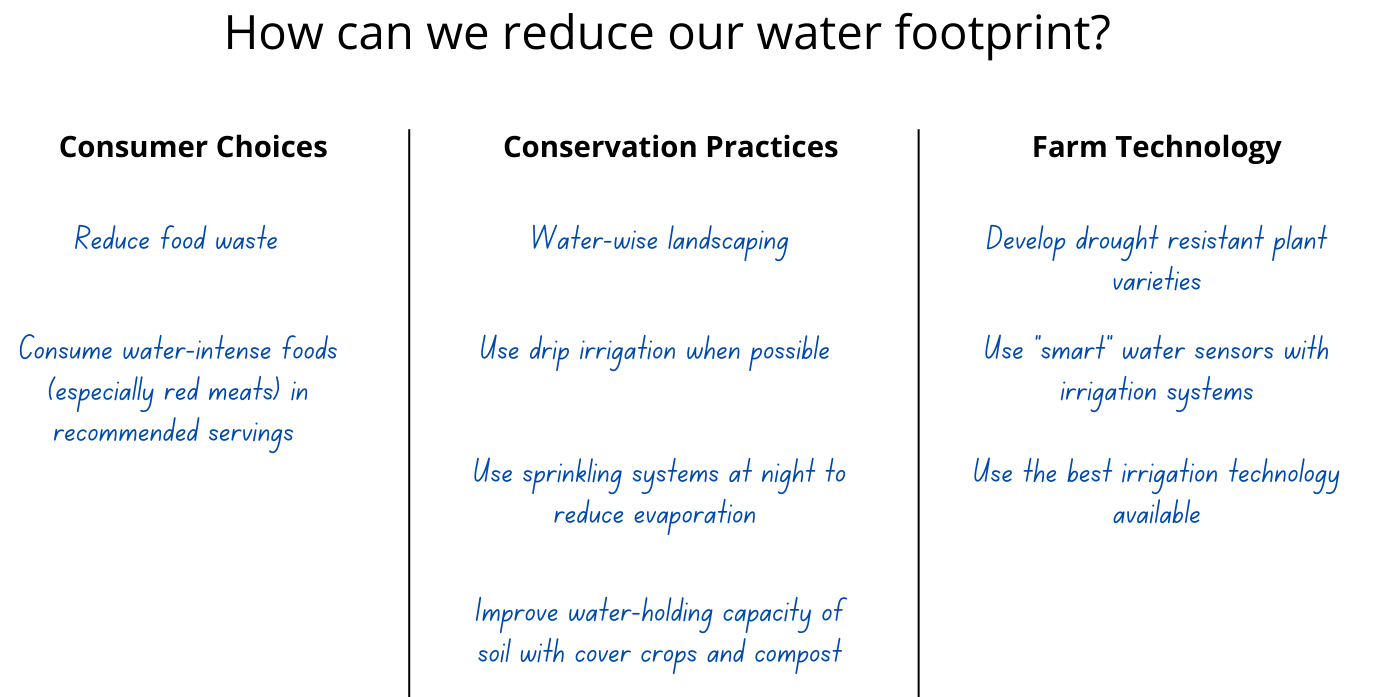
- Ask, "How can we reduce our water footprint?" To discuss the question, break it into categories. Make three columns on the board—Consumer Choices, Conservation Practices, and Farm Technology. Ask students to help brainstorm actions we can take to reduce our water footprint. Each student should come to the board and share one idea. Use ideas from the examples below to help prompt students if needed.
Elaborate
-
Explore the question, "Where does U.S. Crop Irrigation Occur?" use the map from the 2017 Census of Agriculture and read about Irrigation and Water Use.
-
Have students brainstorm a list of all the activities from our daily lives that require water. Use a free website to make a word cloud using their brainstorm list.
-
Create a web quest for students to explore the Water Use and Stress webpage. Students can study graphs and maps to see freshwater withdrawals by country, water withdrawals per capita, freshwater use in agriculture, shares of irrigated agricultural land, and more.
-
This lesson focuses on water. Expand your discussion about the environmental impact of food production by exploring carbon emissions and land use.
-
Take a deeper look at consumptive water use in agriculture. Research irrigation technologies that decrease the amount of water lost to evaporation.
-
Hold a mock trial in class. Assign small groups of students a specific food that is "on trial" for the over-consumption of water. Each group should research the farm-to-fork production of their food and then assign roles in the trial. Some students should work on the side of the "prosecution" communicating the water footprint of the food. The remaining students should act in roles of a "defendent" who finds scientific evidence for why the food should be considered in our diets. Defendents will consider a holistic view of the food including other factors such as providing specific nutrients, carbon footprint, economic sustainability, etc.
-
Research the development of plant varieties that are more drought tolerant. How can biotechnologies and plant breeding decrease agriculture's demand for water?
Evaluate
Review and summarize the following key concepts:
- Everything we use, buy, and eat requires water.
- Some foods require more water to produce than other foods.
- Green, blue, and gray are all types of water.
- Managing water as a (limited) natural resource is one part of our overall sustainability.
Sources
- https://www3.epa.gov/safewater/kids/waterfactsoflife.html
- https://www.ers.usda.gov/topics/farm-practices-management/irrigation-water-use/
- Anisfeld, S. C. 2010 . Water Resources. Washington, DC: Island Press
- Feldman, D. L. 2012. Water. Malden, MA: Polity Press.
- Yates, J. J. 2012. Abundance on trial: the cultural significance of “Sustainability.” The Hedgehog Review14 (2): 8-25
- Hoekstra, A. Y. 2013.The water footprint of modern consumer society. New York: Routledge
- Hoekstra A. Y., and M. M. Mekonnen. 2012. The water footprint of humanity. Proceeding of the National Academy of Sciences (PNAS)109 (9): 3232-3237
- Hoekstra, A. Y. 2003. Virtual water trade. In Proceedings of the International Expert Meeting on Virtual Water Trade, ed. A. Y. Hoekstra. Value of Water Research Report Series No. 12. UNESCO-IHE, Delft, The Netherlands
- Hoekstra, A.Y, A.K. Chapagain, M.M. Aldaya, and M.M. Mekonnen. 2011. The water footprint assessment manual. Washington D.C., USA: Earthscan
- Water Footprint Network. 2017a. Aims and History. http://waterfootprint.org/en/about-us/aims-history (accessed October03, 2017).
- https://ourworldindata.org/water-use-stress
- https://www.nass.usda.gov/Publications/Highlights/2019/2017Census_Irrigation_and_WaterManagement.pdf
- An Active Learning Exercise on Sustainability and the Water Footprint of Food: The Dinner Party Menu Challenge
Acknowledgements
Dinner Party Menu Challenge in Activity 2 used with permission from Dr. Philip Chaney, Department of Geosciences, Auburn University. See the article in The Geography Teacher journal, An Active Exercise on Sustainability and the Water Footprint of Food: The Dinner Party Menu Challenge.
Recommended Companion Resources
Author
Organization
| We welcome your feedback! If you have a question about this lesson or would like to report a broken link, please send us an email. If you have used this lesson and are willing to share your experience, we will provide you with a coupon code for 10% off your next purchase at AgClassroomStore. |